How Many?
A study of spay/neuter
effects on shelter intake
By Lisa
Wahl
Summary: An analysis
of data from 22 areas in 9 states collected 1997-2012 from a variety of sources
shows Spay/Neuter levels above 1/4th of shelter intake result in a
significant decrease in shelter intake.
It started over 10 years ago with a simple question, “How many?” The expert I asked didn’t know. I thought a simple internet search could give me the answer, and when it didn’t, I started on a quest. This chart may be the Holy Grail I was looking for.
It was around 2002 when the Oregon Neutermobile was getting started. The dynamo behind it told me the goal was to park the Neutermobile where there was no other low-cost spay/neuter available and stay there until 70% of the animals in the area were fixed.[1] I asked the simple question above.
Ever since then I’ve been researching on the internet and closely monitoring Oregon shelters and spay/neuter efforts. I’ve been seeing results in Oregon (sometimes staggeringly good results) from spay/neuter while reading reports saying there’s no data to prove that s/n brings down shelter intake.
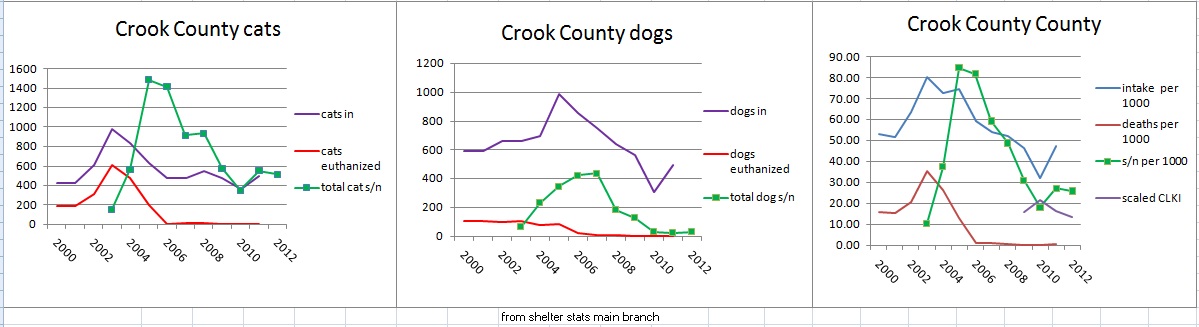
The most impressive results were in Crook County, Oregon. Their only shelter went from one of the highest shelter death rates in Oregon to a No Kill shelter in a few years, primarily thanks to a well-funded spay/neuter clinic.
In every case where I could get the numbers, I found failed spay/neuter programs were not doing anywhere near the number of surgeries relative to either shelter intake or human population as in Oregon’s successes.
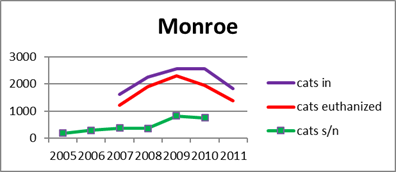
Few areas attacked s/n with an all-out effort such as Crook County. Many areas I looked at were more like Monroe County, TN which, through a Maddie’s Grant, saw only a continued increase in cat intake during a moderate s/n program, but a rapid decrease when the s/n numbers increased.
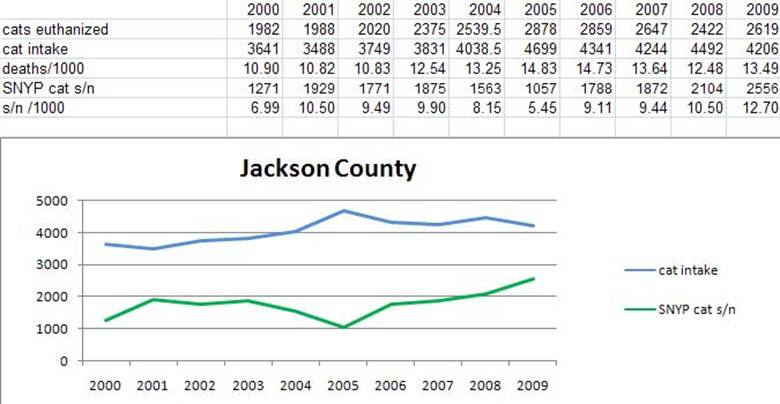
Although, perhaps what I found most convincing was the case of Jackson County, Oregon, where the SNYP voucher program was cutting-edge at the time. As you can see, the county shelter’s cat intake has been almost a mirror image of the number of vouchers issued, showing that the increase or decrease in low-cost s/n available had an immediate effect on intake.
As time passed, data accumulated and increasingly became available on the internet. This report is based on data from 22 areas in 9 states collected 1997-2012 from a variety of sources. Each year was evaluated separately for cats, dogs, and both species together. That made for over 400 data points to consider for analysis.
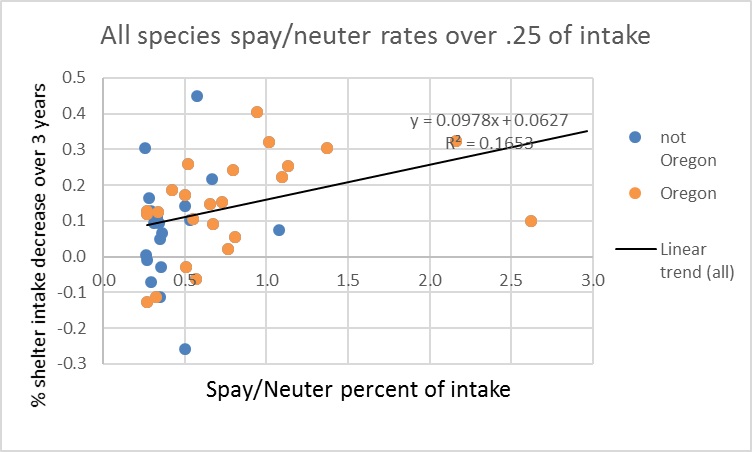
I often focus on the data for cats, reasoning that the flood of intake during “Kitten Season” would be most likely to benefit from s/n quickly. However, the strongest correlation was in this study takes both species together, although this may be because in some cases, I did not have a species break-down for each year.
The chart graphs percentage of spay/neuter surgeries compared to the total shelter intake for the given year (Y axis) against the percentage of decrease in the shelter intake from the year before to the 3 years after. (X axis) Not included in the chart are cases where s/n is below ¼ of the intake because there is no significant correlation. Even at .25, shelter intake often increases. But as the rate gets higher, shelter intake decreases more and more dramatically. The most accurate data used are from Oregon examples, most of which are unaffiliated with any program. Non-Oregon data are mostly from Humane Alliance affiliated clinics and Maddie’s fund programs with less data available to me and lower s/n rates.
The result is a clear link between spay/neuter and decrease in shelter intake, if the spay/neuter numbers are high enough. There are too many variables for there to be a reliable formula such I’ve seen claimed such as “Every 100 surgeries reduces intake by . . .” or “Every surgery saves $x in shelter costs.” But there does seem to be a workable rule of thumb that spay/neuter levels above 1/4th of shelter intake result in a significant decrease in shelter intake.